Descriptive Analysis. Basic statistical summaries, data visualization, and trend identification.
By Allschoolabs
• Published on August 5, 2025
4 views
Category: Data Analysis
- Last updated: August 5, 2025
Descriptive Analysis: Understanding and Summarizing Data
Descriptive analysis is the foundational step in data analysis, focusing on summarizing and interpreting data to understand its main characteristics. It provides insights into what has happened in a dataset through simple statistical methods and visual representations. Unlike inferential analysis, it does not attempt to draw conclusions or make predictions but rather aims to describe the present or past data effectively.
1. Basic Statistical Summaries
Statistical summaries help in quantifying the essential features of data. They include:
Measures of Central Tendency:
Mean: The average value.
Median: The middle value when data is ordered.
Mode: The most frequently occurring value.
Measures of Dispersion:
Range: Difference between the maximum and minimum values.
Variance: Measure of how data points differ from the mean.
Standard Deviation: The square root of variance; indicates spread.
Shape and Distribution:
Skewness: Describes the asymmetry of the data distribution.
Kurtosis: Measures the "tailedness" of the distribution.
These metrics provide a quantitative snapshot of the data, allowing analysts to quickly grasp the data's spread, center, and structure.
2. Data Visualization
Visual representation is crucial in descriptive analysis as it enhances understanding and reveals patterns that may be missed in raw numbers.
Common visual tools include:
Histograms: Show the distribution of data points across ranges.
Boxplots: Highlight median, quartiles, and outliers.
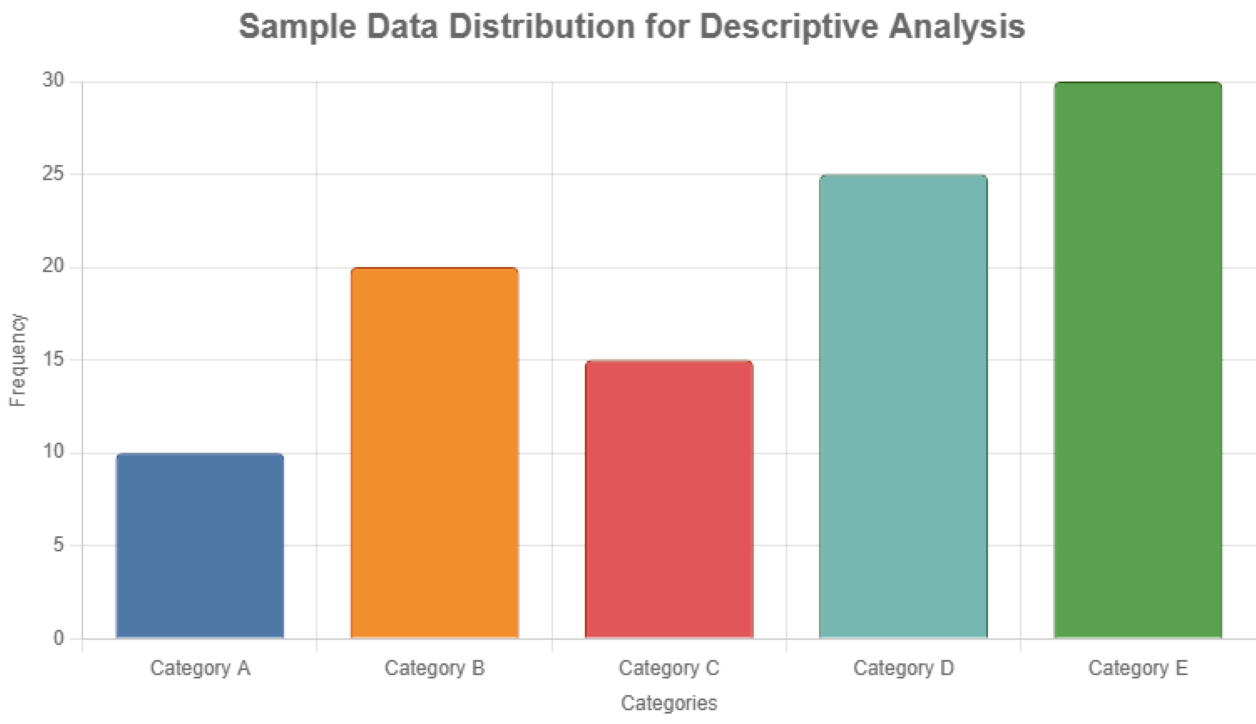
Bar Charts: Useful for categorical data comparison.
Pie Charts: Represent proportions within a whole.
Line Graphs: Depict changes over time or sequences.
Scatter Plots: Reveal relationships or correlations between two variables.
Visualization aids in communicating insights more intuitively and can uncover hidden patterns, anomalies, and groupings.
3. Trend Identification
Identifying trends involves recognizing patterns or movements in the data over time. This can include:
Upward or Downward Trends: Consistent increase or decrease in values.
Seasonal Patterns: Regular fluctuations based on time (e.g., monthly sales peaks).
Cyclical Trends: Long-term oscillations due to broader influences like economic cycles.
Outliers: Abnormal spikes or drops indicating anomalies.
Techniques such as moving averages and smoothing lines in graphs (like trendlines in Excel) can assist in clarifying these trends.
Applications of Descriptive Analysis
Descriptive analysis is used across various fields:
Business: To monitor KPIs like revenue, customer acquisition, and churn rates.
Healthcare: For summarizing patient data and health statistics.
Education: To analyze student performance and attendance records.
Public Policy: For demographic analysis and public service utilization.
Finance: To track market trends and portfolio performance.
Conclusion
Descriptive analysis is a powerful tool to summarize, visualize, and explore data. It forms the basis for more advanced analytics by providing a clear picture of what is happening in a dataset. Through statistical summaries, visual aids, and trend recognition, it enables data-driven understanding and informed decision-making.